Generated by AI — ask for more. Every page here was produced by the assistant from a GMNS network plus a link speed /
link_performance table (or an AI solver's output). Ask it to generate the same views for additional data — e.g. the ITS I-95 corridors, or other years of the same corridor. Provide the network + speeds and name the corridor and date; the calendar view already spans a whole year, so multi-year is just another run.Network dashboards — the base HTML
Self-contained offline dashboards (network + basemap embedded): layers, MOE modes, trajectory animation. gui4gmns's primary output. Large networks (ARC, Chicago Regional) are generate-on-demand.
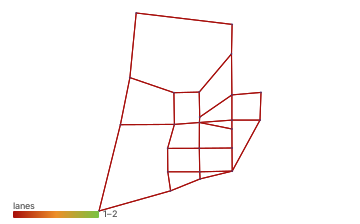
Classic transportation test network — the standard TAP benchmark.
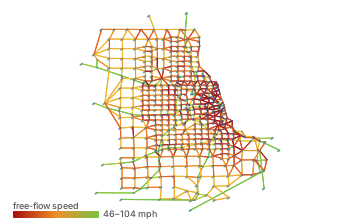
Regional sketch network with demand, assignment and link performance.
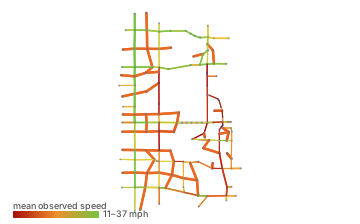
Real signalized corridor; links colored by observed mean speed.
Corridor state-views HTML
Per corridor: calendar (whole year by day/year) · network (corridor map by mean speed) · space-time (milepost×time speed heatmap). gui4gmns <view>_<corridor>_<date> convention.
🗺I210E
Corridor samples: gui4gmns / TrafficFlowBench-CA benchmark; corridor speeds derived from Caltrans PeMS (public agency data). Released for public use.
--cmap cb).
· Full index incl. static figures: gallery.html